In the chart above, we can see data on the number of reported natural disasters over time.
This change over time can be influenced by a number of factors, namely the increased coverage of reporting over time and of course satellite technology which began its infancy ironically in 1957 and has ironically enabled scientists to track the demise of our world much better since then. . .
We can see in the graph above from Our World in Data showing a slight rise from increasing natural disasters over time, however, what happens to the explosion of data on the graph after 1957 shows something quite extraordinary happening! Natural disasters inexplicitly began rising significantly after 1957.
Another graph below, also from Our World In Data, shows the incredible rise of people affected by natural disasters since 1957.
According to scientists, during solar minimum, there is a maximum in the number of Cosmic rays, high energy particles whose source is outside our Solar system, reaching Earth. There is a theory that cosmic rays can create nucleation sites in the atmosphere which seed cloud formation and create cloudier conditions. If this were true, then there would be a significant impact on climate, which would be modulated by the 11-year solar cycle.
Our Sun obviously is at the very least partly to blame for global warming here on Earth. It went quite clearly ballistic with sunspots and solar activity in 1957 climaxing at Christmas. But, what happened next here on Earth is truly astonishing. Consequently, seismic and volcanic activity and other natural disaster events began increasing simultaneously along with the beginning of animal and insect deaths, the demise of our oceans and global warming here on Earth, resulting in the extreme weather problems we endure today and it all began directly after 1957.
Above is a very interesting graph which was posted by Wikipedia around 2019, I believe. They have come to the same conclusion. The graph shows, quite correctly how all-natural disasters around the world suddenly began to increase rapidly in the late 50s' (I have added the 1957 broken line to emphasise the rise in natural disasters since then.) Floods and cyclones are added to the graph above.
NASA are the first to tell us:
"Without the Sun’s energy, life as we know it could not exist on our home planet."
However, too much energy and we have an inverted scenario . . .
Below sea surface temps since 1957. It's just the same, of course. . .
According to NASA, 90% of global warming is occurring in our oceans!
There has been an increase in ocean heat content during recent decades as the oceans absorb over 90% of the heat from global warming. Above, is a chart by RCraig09 - showing the heat content of the ocean, top 200m and top 700m, since 1957. Can you imagine the carnage from storms, hurricanes, and typhoons if this rise in sea temperatures carries on just for another 5 years? The continued rise would also be lethal for a large percentage of marine life. . .
Below, a diverse range of mammals once roamed the planet. This changed quickly and dramatically with the arrival of humans. Since the rise of humans, wildland mammal biomass has declined by "85%." Our history with them has been a zero-sum game: we either hunted them or took over their habitats by expanding agricultural lands. With these wild habitats to expand into and produce food on, the rise of humans was possible. However, look what happened just after 1957, surely something more than climate change is going on here?
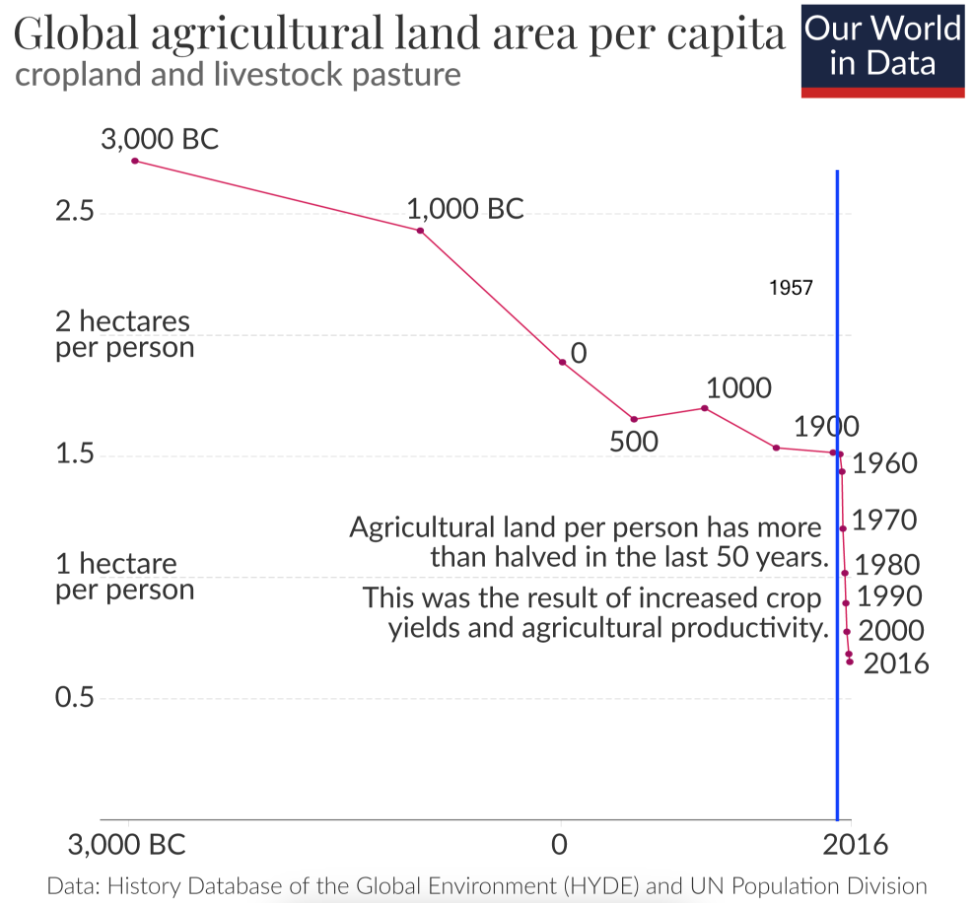
Since the rise of humans, wildland mammal biomass has declined by around 85%, however, the frightening statistic is this. Up to 50 years ago wildland mammal biomass had declined by just 15%. In just the last 50 years wildland mammal biomass has declined by an incredible 70%—Let me just put that statistic into some kind of "human" perspective—Try to imagine, if more than "5.5 billion people” had unexpectedly died in the last 50 years, (70% of the world's current population)—leaving just “2.5 billion survivors!” Now—That would make the 6-0-clock news for sure, and our world would be in a panic! However, we hardly hear anything regarding the animal's tragic fate on the telly!!
To make matters worse, many of the wild animals today simply have no natural habitat to live in any way—Nearly 80% of the terrestrial environment on our planet has been severely altered or damaged by humans, along with almost 70% of oceanic environments. And if humans don't get yah, the extreme weather will, for instance, in 2019, more than two billion wild animals died in Australia's record-busting wildfires!
More than one million species are threatened with extinction in the coming decades. Vertebrates, for instance, have declined by almost 70% in just the last five years! If we could somehow find a way to fix the climate, we would still have to find a way to fix the demise of our animals? Simply put—We can’t!
Below, the Living Planet Report Of 2020 recorded a decline of almost 70% in average animal population abundance since 1970. PS. I have added the blue arrow and text.
The Living Planet Report Of 2020 recorded a decline of almost 70% in average animal population abundance since 1970, that statistic has only gotten worse in the last three years of course.
Authors note: (I can't find any data going back to the mid to late '50s but it is safe to assume, the decline of the species didn't just suddenly begin in 1970 and is probably tied in with the sudden burst of chaos which hit our planet in the year 1957.
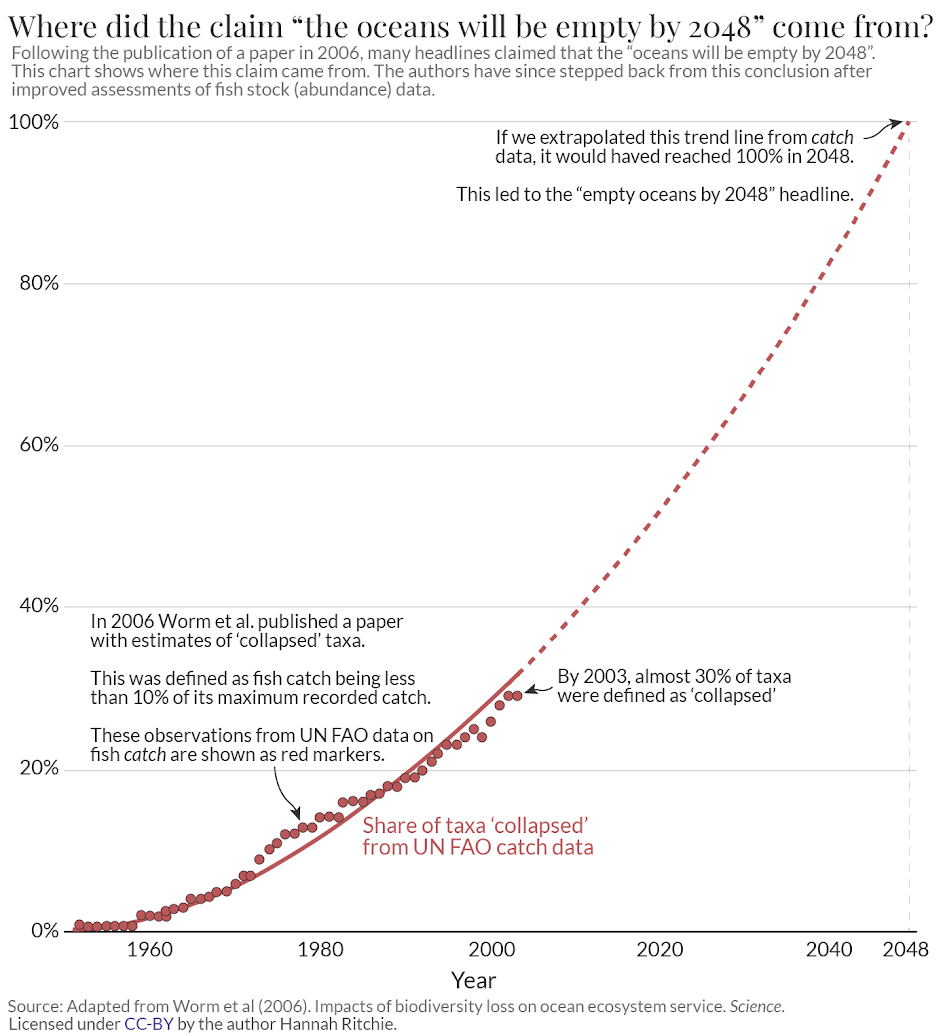
Fish. When will the oceans be empty?
In 2006, the fisheries researcher Boris Worm and his colleagues published a paper in Science, on the trends in biodiversity loss in the world’s oceans. The year 2048 is expected as the year of a ‘global collapse. He says:
“Our data highlight the societal consequences of an ongoing erosion of diversity that appears to be accelerating on a global scale."
"This trend is of serious concern because it projects the global collapse of all taxa currently fished by the mid–21st century (based on the extrapolation of regression to 100% in the year 2048)."
The authors no longer stand by their original claim. The aftermath of their paper in 2006 created a lot of uproar in the fishery research community. There were many rebuttal papers challenging this position.
The research community had previously been divided: one camp had a more optimistic take on the status of the world’s fisheries and prospects for the future; one had a more pessimistic take. Boris Worm fell into the latter. Some may say Boris Worm was being a tad optimistic!
The decline of industrial fishing in the UK since 1957!
We can see very clearly any increase in fish catch was interrupted by the two World Wars: we see the dramatic declines in catch shown on the chart between the war years 1914—18 and 1939—45. However, the dramatic cliff-drop appeared after 1957 when stocks ceased to exist, never to recover . . . It is amazing to think that the UK is made up of more than 6,000 islands yet fish is these days mostly imported, the once mighty fishing industry is now mostly abandoned.
Yes! Even we as a species started declining rapidly around 1957.
The global population growth rate peaked long ago. The chart below shows that global population growth reached a peak in 1962 and 1963 (and not 1957 as I have shown.) with an annual growth rate of 2.2%; but since then, world population growth has halved. For the last half-century, we have lived in a world in which the population growth rate has been declining. The UN projects that this decline is continuing and will increase in the coming decades.
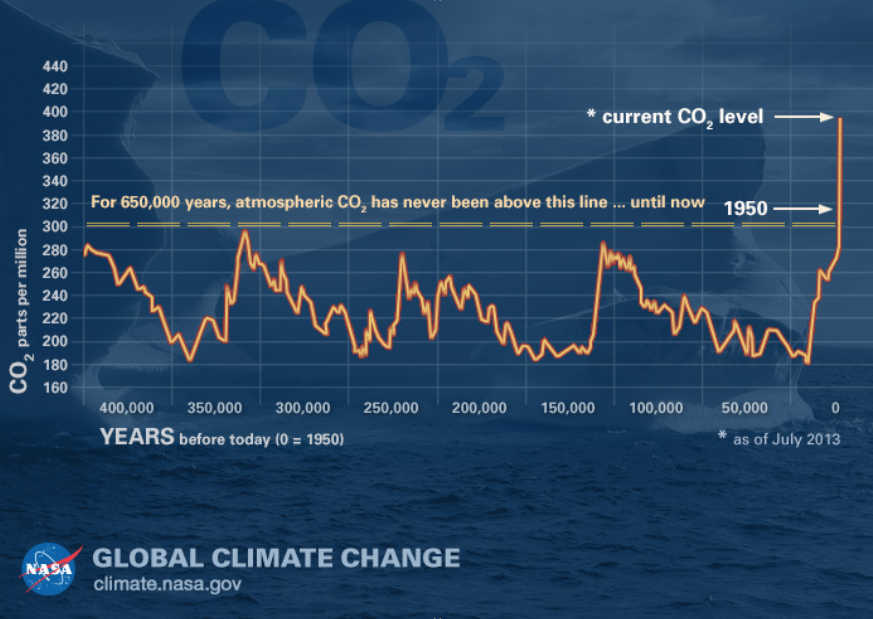
Below—Credit NASA.
Once again, another graph from NASA this time showing the incredible rise of CO2 since around the 1900s—smashing through the CO2 300 parts per million during the '1950s. (No specific year given but obviously around our ballpark period of 1957)
But could this incredible spike be caused by mankind, and a sudden increase in factory and travel emissions? Or was it caused by the unprecedented explosion of nuclear bomb testing and the introduction of rockets? Did God decide, that enough is enough?
Christmas 1957 saw two very important Bible prophecies come together. Great Earthquakes In One Place And Another and Great Signs From Heaven.
Is it “coincidental,” that almost immediately after, a disastrous decline of "everything" took place here on Earth? Animals, marine life, pollinators and insects. Their deaths are still accelerating at an unsustainable level!—Around one million species are expected to become extinct in the next decade according to the World Wildlife Fund, (WWF) and this awful decline is thought to have started around the same time, yes, the late ‘50s, early ‘60s. But that’s not all, we mustn’t forget the incredible decline in the health of our oceans rivers, ecosystems and agriculture as well.
Our society is dying as fast as our environment.
And we can't stop it, the harder we try, the worse it gets because it's impossible to stop it, we have prophecies which need to be fulfilled and nothing can stop them.
And if the graphs above prove anything, next week I will show you not just how mankind triggered this tragedy but how they poured accelerant on the fire too!
The Watcher On The Wall—1957


3 comments:
Bullpucky! I have never seen such an accumulation of lies and misinformation.
Yes Anonymous, lies and misinformation in ALL global governments "data" to track these environmental changes over time because the graphs are fudged down! Wiki shrunk the chart is noted. The situation is exponentially worse then the data shows!
However, all these lies start on the same date, why?
Post a Comment