A nearly full moon made it possible for the day-night band of NOAA-20's Visible Infrared Imaging Radiometer Suite (VIIRS) to capture this view of Tropical Depression Barry early Monday morning. Barry slowly lifted north across the Mississippi Valley on July 15, 2019, where the system continues to produce very heavy rainfall that could trigger significant flash flooding in some areas.
The remnants of the once-mighty storm Barry, the first hurricane of the 2019 season, dumped dangerous amounts of rain as it crawled north through the United States on Monday after coming ashore west of New Orleans at the weekend.
2019 has proved to be a disaster for the farming industry in the US, with NOAA earlier this month claiming the U.S. had its wettest 12 months on record.
The constant deluge this year has caused thousands of American farmers to file for bankruptcy due to saturated fields and the cancellation of planting seeds which will undoubtedly result in food shortages and higher prices in the supermarket.
NOAA reports- Rain – and plenty of it – was the big weather story in June, adding to a record-breaking 12 months of precipitation for the contiguous U.S. It's the third consecutive time in 2019 (April, May and June) the past 12-month precipitation record has hit an all-time high.
Here’s a snapshot of NOAA’s U.S. climate report for June and the year to date:
Climate by the numbers
June 2019
Wet conditions from July 2018 through June 2019 resulted in a new 12-month precipitation record in the U.S., with an average of 37.86 inches (7.90 inches above average), according to scientists at NOAA’s National Centers for Environmental Information.
The average precipitation for June was 3.30 inches (0.37of an inch above average), placing it in the upper third in the record books. Flooding conditions persisted along the central and Lower Mississippi, Missouri and Illinois rivers.
The average June temperature across the contiguous U.S. was 68.7 degrees F (0.2 degrees above average), which ranked in the middle third of the 125-year record. Eleven states along the Pacific, Gulf, New England and the Mid-Atlantic coasts had much-above-average temperatures.
Year to date | January through June
The average U.S. temperature for the year to date (January through June) was 47.6 degrees F (0.1 of a degree above average), which ranked in the middle third for the six-month period. Through June, the average total precipitation for the year – 19.05 inches – was 3.74 inches above average.
Drought was a mixed bag: About 3.2 per cent of the contiguous U.S. was in drought, down from 5.3 per cent at the start of June. However, drought conditions worsened across parts of the Pacific Northwest and Puerto Rico.
Alaska baked: The northernmost state had its second-hottest June on record, with an average temperature of 54.0 degrees F (4.8 degrees above average.)
2019 in Progress…
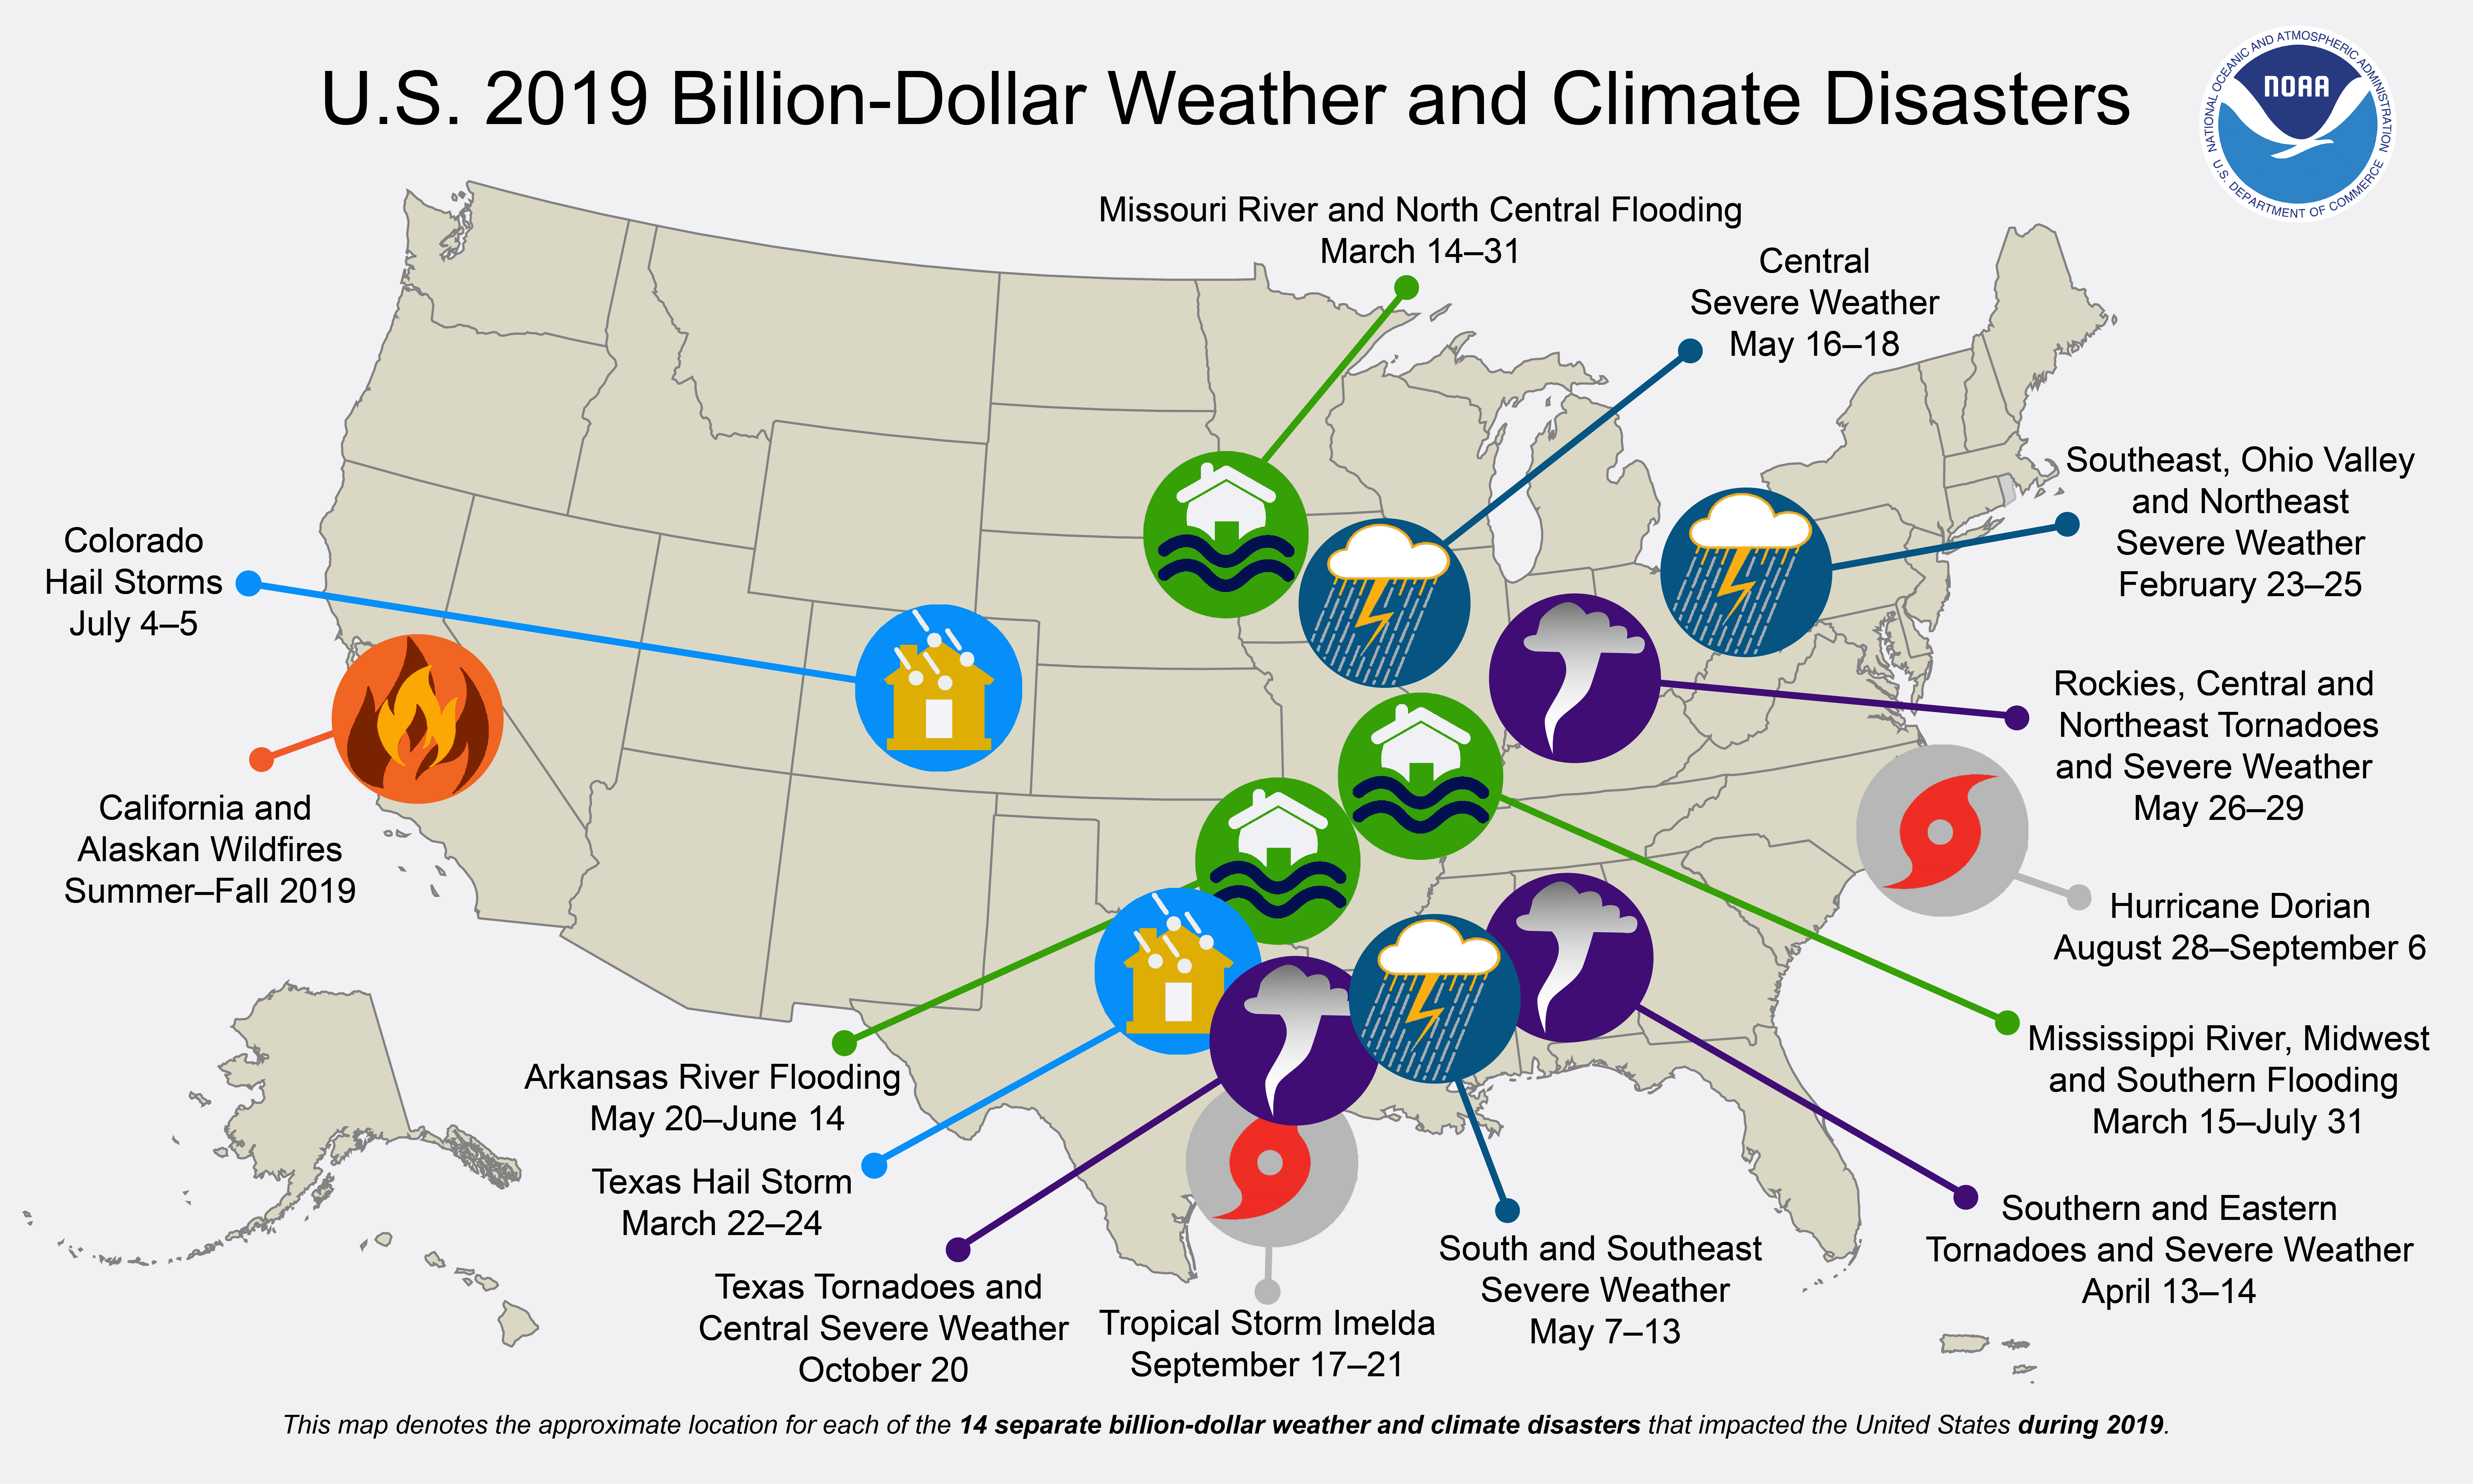
In 2019 (as of July 9), there have been 6 weather and climate disaster events with losses exceeding $1 billion each across the United States. These events included 2 flooding events and 4 severe storm events. Overall, these events resulted in the deaths of 15 people and had significant economic effects on the areas impacted. The 1980–2018 annual average is 6.3 events (CPI-adjusted); the annual average for the most recent 5 years (2014–2018) is 12.6 events (CPI-adjusted).

During 2018, the U.S. experienced an active year of billion-dollar disaster events including the 4th highest total number of events, only behind the years 2017, 2011 and 2016. In 2018, the U.S. also experienced the 4th highest total costs ($91 billion) only behind the years 2017, 2005 and 2012.
Climate Change
Front Page

No comments:
Post a Comment